

Ever wondered how MHT CET ensured a level playing field in 2024—when over 6,75,445 candidates tackled different question sets across multiple sessions? Because some MHT CET sessions were harder than others, fair results were needed.
That’s where the normalization process comes in!
To address this, the State Common Entrance Test Cell has implemented a normalization process for the MHT CET results.
The Normalization Process
The normalization process adopted for MHT CET 2025 aligns with methodologies used in other significant educational exams in India. The motive of the process is to adjust scores based on the relative performance of candidates across various shifts. The end result (i.e. your MHT CET score) of this normalization process is represented in terms of a percentile score.
Understanding Percentile Scores
A percentile score indicates the percentage of candidates who have scored equal to or below a particular score.
For example: A percentile of 90 means the candidate scored higher than 90% of those in their session of the MHT CET.
Procedure for Normalization and Preparation of Percentile Score:
Imagine the MHT CET exam is like a big event happening over two days, with two groups of students taking the test each day. They split all the students into four roughly equal groups. Think of it like sorting a big pile of papers into four smaller, even stacks.
Each group gets a specific time to take the test:
- Session-1: Day-1 Batch-1
- Session-2: Day-1 Batch-2
- Session-3: Day-2 Batch-1
- Session- 4: Day-2 Batch-2
Preparing Results for Each Session
The two formats given below will be used for the preparation of results:
- Raw scores
- Percentile scores
Suppose a test was conducted in 4 sessions as per the details given below: Distribution of candidates:
Session-1: Day-1 Batch-1
Session-2: Day-1 Batch-2
Session-3: Day-2 Batch-1
Session- 4: Day-2 Batch-2
| No. of Candidates | Marks | |||||
| Session | Day-Batch | Absent | Present | Total | Highest | Lowest |
| 1 | D1 B1 | 150 | 2249 | 2399 | 154 | 1 |
| 2 | D1 B2 | 186 | 2272 | 2458 | 157 | 0 |
| 3 | D2 B1 | 215 | 2216 | 2431 | 149 | 0 |
| 4 | D2 B2 | 166 | 2257 | 2423 | 161 | 0 |
In this scoring method, the highest raw score in each paper will be assigned a percentile of 100. This shows that 100% of the aspirants have equal or lower scores than the highest scorer or topper in that session.
Highest raw score and percentile score:
The highest raw marks in each session will be assigned a normalized percentile score of 100.
| Session | Total Candidates Appeared | Highest Raw Score | Candidates Who Scored EQUAL OR LESS THAN the Highest Raw Score | Percentile Score | Remarks |
| 1 | 2249 | 154 | 2249 |
100.0000000 [(2249/2249)*100] |
i.e. all the highest raw scores would be normalized to 100 Percentile Score for their respective session. |
| 2 | 2272 | 157 | 2272 |
100.0000000 [(2272/2272)*100] |
|
| 3 | 2216 | 149 | 2216 |
100.0000000 [(2216/2216)*100] |
|
| 4 | 2257 | 161 | 2257 |
100.0000000 [(2257/2257)*100] |
Lowest raw score and percentile score:
The percentile for the lowest raw scores in each session is calculated considering the total number of candidates within that same session.
| Session | Total Candidates Appeared | Lowest Raw Score | Candidates Who Scored EQUAL OR LESS THAN Lowest Raw Score | Percentile Score | Remarks |
| 1 | 2249 | 1 | 2 |
(2/2249) [(2/2249)*100] |
i.e. all the highest raw scores would be normalized to 100 Percentile Score for their respective session. |
| 2 | 2272 | 0 | 2 |
(2/2272) [(2/2272)*100] |
|
| 3 | 2216 | 0 | 1 |
(1/2216) [(1/2216)*100] |
|
| 4 | 2257 | 0 | 2 |
(2/2257) [(2/2257)*100] |
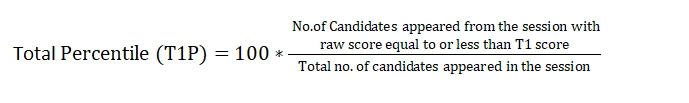
How to Calculate Percentile Scores
The Percentile Scores will be calculated up to 7 decimal places to avoid bunching effect and reduce ties. Percentile score is not the same as percentage of marks obtained.
The Percentile score of a Candidate is calculated as follows:


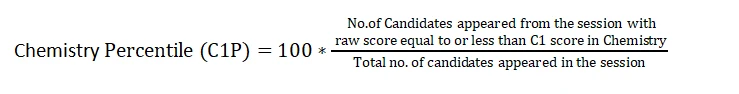
Compilation of MHT CET Scores
The final MHT CET scores, used for the results, will be created by combining the percentile scores calculated for the total raw scores from all four sessions. Additionally, separate percentile scores will be calculated for the total raw score and for the individual raw scores in Mathematics, Physics, and Chemistry within each of the four sessions.
| PERCENTILE : SESSION-1 i.e. DAY-1 Batch-1 | ||||||||
| Roll Number | Physics | Chemistry | Mathematics | PCM Total | ||||
| Raw Score | Percentile | Raw Score | Percentile | Raw Score | Percentile | Raw Score | Percentile | |
| D1 B1-01 | 38 | 89.2841263 | 30 | 100 | 86 | 99.9555358 | 154 | 100 |
| D1 B1-02 | 45 | 100 | 26 | 99.0217875 | 83 | 98.9773233 | 154 | 100 |
| D1 B1-03 | 45 | 100 | 22 | 92.0409071 | 86 | 99.9555358 | 153 | 99.9119718 |
| D1 B1-04 | 45 | 100 | 22 | 92.0409071 | 86 | 99.9555358 | 153 | 99.9119718 |
| D1 B1-05 | 45 | 100 | 26 | 99.0217875 | 82 | 98.710538 | 153 | 99.9119718 |
| ↓ | ↓ | ↓ | ↓ | ↓ | ↓ | ↓ | ↓ | ↓ |
| ↓ | ↓ | ↓ | ↓ | ↓ | ↓ | ↓ | ↓ | ↓ |
| ↓ | ↓ | ↓ | ↓ | ↓ | ↓ | ↓ | ↓ | ↓ |
| D1 B1-2244 | 3 | 3.5571365 | 2 | 6.8030236 | 2 | 2.4010671 | 7 | 1.3644366 |
| D1 B1-2245 | 2 | 2.4455313 | 0 | 1.2449978 | 3 | 2.801245 | 5 | 1.2323944 |
| D1 B1-2246 | 1 | 1.734104 | 0 | 1.2449978 | 3 | 2.801245 | 4 | 1.1883803 |
| D1 B1-2247 | 0 | 0.3112494 | 2 | 6.8030236 | 0 | 0.5780347 | 2 | 1.1443662 |
| D1 B1-2248 | 0 | 0.3112494 | 1 | 2.7567808 | 0 | 0.5780347 | 1 | 1.1003521 |
| D1 B1-2249 | 1 | 1.734104 | 0 | 1.2449978 | 0 | 0.5780347 | 1 | 1.1003521 |
| PERCENTILE : SESSION-2 i.e. DAY-1 Batch-2 | ||||||||
| Roll Number | Physics | Chemistry | Mathematics | PCM Total | ||||
| Raw Score | Percentile | Raw Score | Percentile | Raw Score | Percentile | Raw Score | Percentile | |
| D1 B2-01 | 45 | 100 | 30 | 100 | 82 | 99.9559859 | 157 | 100 |
| D1 B2-02 | 45 | 100 | 30 | 100 | 82 | 99.9559859 | 157 | 100 |
| D1 B2-03 | 45 | 100 | 30 | 100 | 82 | 99.9559859 | 157 | 100 |
| D1 B2-04 | 41 | 97.5792254 | 30 | 100 | 82 | 99.9559859 | 153 | 99.8679577 |
| D1 B2-05 | 41 | 97.5792254 | 26 | 94.6742958 | 86 | 100 | 153 | 99.8679577 |
| ↓ | ↓ | ↓ | ↓ | ↓ | ↓ | ↓ | ↓ | ↓ |
| ↓ | ↓ | ↓ | ↓ | ↓ | ↓ | ↓ | ↓ | ↓ |
| ↓ | ↓ | ↓ | ↓ | ↓ | ↓ | ↓ | ↓ | ↓ |
| D1 B2-2268 | 3 | 4.665493 | 1 | 2.1126761 | 0 | 0.528169 | 4 | 0.2200704 |
| D1 B2-2269 | 2 | 3.3010563 | 0 | 0.9242958 | 1 | 0.9683099 | 3 | 0.1760563 |
| D1 B2-2270 | 1 | 2.4647887 | 0 | 0.9242958 | 0 | 0.528169 | 1 | 0.1320423 |
| D1 B2-2271 | 0 | 0.4841549 | 0 | 0.9242958 | 0 | 0.528169 | 0 | 0.0880282 |
| D1 B2-2272 | 0 | 0.4841549 | 0 | 0.9242958 | 0 | 0.528169 | 0 | 0.088028 |
| PERCENTILE : SESSION-3 i.e. DAY-2 Batch-1 | ||||||||
| Roll Number | Physics | Chemistry | Mathematics | PCM Total | ||||
| Raw Score | Percentile | Raw Score | Percentile | Raw Score | Percentile | Raw Score | Percentile | |
| D2 B1-01 | 37 | 96.6155235 | 30 | 100 | 82 | 99.8646209 | 149 | 100 |
| D2 B1-02 | 41 | 99.4584838 | 26 | 96.6155235 | 82 | 99.8646209 | 149 | 100 |
| D2 B1-03 | 45 | 100 | 23 | 87.8610108 | 78 | 98.5108303 | 146 | 99.9119718 |
| D2 B1-04 | 41 | 99.4584838 | 26 | 96.6155235 | 79 | 99.0974729 | 146 | 99.9119718 |
| D2 B1-05 | 41 | 99.4584838 | 30 | 100 | 74 | 94.9909747 | 145 | 99.8239437 |
| ↓ | ↓ | ↓ | ↓ | ↓ | ↓ | ↓ | ↓ | ↓ |
| ↓ | ↓ | ↓ | ↓ | ↓ | ↓ | ↓ | ↓ | ↓ |
| ↓ | ↓ | ↓ | ↓ | ↓ | ↓ | ↓ | ↓ | ↓ |
| D2 B1-2212 | 2 | 5.099278 | 1 | 1.2635379 | 2 | 3.4747292 | 5 | 2.7288732 |
| D2 B1-2213 | 1 | 3.2039711 | 2 | 3.8357401 | 2 | 3.4747292 | 5 | 2.7288732 |
| D2 B1-2214 | 1 | 3.2039711 | 2 | 3.8357401 | 2 | 3.4747292 | 5 | 2.7288732 |
| D2 B1-2215 | 3 | 8.4837545 | 0 | 0.5866426 | 0 | 1.0379061 | 3 | 2.5528169 |
| D2 B1-2216 | 0 | 1.0830325 | 0 | 0.5866426 | 0 | 1.0379061 | 0 | 2.5088028 |
| PERCENTILE : SESSION-4 i.e. DAY-2 Batch-2 | ||||||||
| Roll Number | Physics | Chemistry | Mathematics | PCM Total | ||||
| Raw Score | Percentile | Raw Score | Percentile | Raw Score | Percentile | Raw Score | Percentile | |
| D2 B2-01 | 41 | 100 | 30 | 100 | 90 | 100 | 161 | 100 |
| D2 B2-02 | 41 | 100 | 30 | 100 | 90 | 100 | 161 | 100 |
| D2 B2-03 | 41 | 100 | 30 | 100 | 86 | 99.0695614 | 157 | 99.9113868 |
| D2 B2-04 | 41 | 100 | 30 | 100 | 86 | 99.0695614 | 157 | 99.9113868 |
| D2 B2-05 | 37 | 98.5378821 | 30 | 100 | 90 | 100 | 157 | 99.9113868 |
| ↓ | ↓ | ↓ | ↓ | ↓ | ↓ | ↓ | ↓ | ↓ |
| ↓ | ↓ | ↓ | ↓ | ↓ | ↓ | ↓ | ↓ | ↓ |
| ↓ | ↓ | ↓ | ↓ | ↓ | ↓ | ↓ | ↓ | ↓ |
| D2 B2-2253 | 3 | 14.4882588 | 0 | 0.664599 | 0 | 0.7975188 | 3 | 0.3101462 |
| D2 B2-2254 | 0 | 1.9051839 | 2 | 4.8294196 | 0 | 0.7975188 | 2 | 0.1772264 |
| D2 B2-2255 | 0 | 1.9051839 | 0 | 0.664599 | 1 | 1.5950377 | 1 | 0.1329198 |
| D2 B2-2256 | 0 | 1.9051839 | 0 | 0.664599 | 0 | 0.7975188 | 0 | 0.0886132 |
| D2 B2-2257 | 0 | 1.9051839 | 0 | 0.664599 | 0 | 0.7975188 | 0 | 0.0886132 |
To get the final percentiles, the percentile scores from all four test sessions will be combined. This will give us the overall percentile, as well as separate percentiles for Mathematics, Physics, and Chemistry. These combined percentile scores will then be used to create the final CET scores.
| PERCENTILE : All 4 Sessions Combined | ||||||||
| Roll Number | Physics | Chemistry | Mathematics | PCM Total | ||||
| Raw Score | Percentile | Raw Score | Percentile | Raw Score | Percentile | Raw Score | Percentile | |
| D1 B1-01 | 38 | 89.2841263 | 30 | 100 | 86 | 99.9555358 | 154 | 100 |
| D1 B1-02 | 45 | 100 | 26 | 99.0217875 | 83 | 98.9773233 | 154 | 100 |
| D1 B2-01 | 45 | 100 | 30 | 100 | 82 | 99.9559859 | 157 | 100 |
| D1 B2-02 | 45 | 100 | 30 | 100 | 82 | 99.9559859 | 157 | 100 |
| D1 B2-03 | 45 | 100 | 30 | 100 | 82 | 99.9559859 | 157 | 100 |
| D2 B1-01 | 37 | 96.6155235 | 30 | 100 | 82 | 99.8646209 | 149 | 100 |
| D2 B1-02 | 41 | 99.4584838 | 26 | 96.6155235 | 82 | 99.8646209 | 149 | 100 |
| D2 B2-01 | 41 | 100 | 30 | 100 | 90 | 100 | 161 | 100 |
| D2 B2-02 | 41 | 100 | 30 | 100 | 90 | 100 | 161 | 100 |
| D1 B1-03 | 45 | 100 | 22 | 92.0409071 | 86 | 99.9555358 | 153 | 99.9119718 |
| ↓ | ↓ | ↓ | ↓ | ↓ | ↓ | ↓ | ↓ | ↓ |
| ↓ | ↓ | ↓ | ↓ | ↓ | ↓ | ↓ | ↓ | ↓ |
| ↓ | ↓ | ↓ | ↓ | ↓ | ↓ | ↓ | ↓ | ↓ |
| ↓ | ↓ | ↓ | ↓ | ↓ | ↓ | ↓ | ↓ | ↓ |
| ↓ | ↓ | ↓ | ↓ | ↓ | ↓ | ↓ | ↓ | ↓ |
| ↓ | ↓ | ↓ | ↓ | ↓ | ↓ | ↓ | ↓ | ↓ |
| ↓ | ↓ | ↓ | ↓ | ↓ | ↓ | ↓ | ↓ | ↓ |
| ↓ | ↓ | ↓ | ↓ | ↓ | ↓ | ↓ | ↓ | ↓ |
| ↓ | ↓ | ↓ | ↓ | ↓ | ↓ | ↓ | ↓ | ↓ |
| D2 B2-2253 | 3 | 14.4882588 | 0 | 0.664599 | 0 | 0.7975188 | 3 | 0.3101462 |
| D1 B2-2268 | 3 | 4.665493 | 1 | 2.1126761 | 0 | 0.528169 | 4 | 0.2200704 |
| D2 B2-2254 | 0 | 1.9051839 | 2 | 4.8294196 | 0 | 0.7975188 | 2 | 0.1772264 |
| D1 B2-2269 | 2 | 3.3010563 | 0 | 0.9242958 | 1 | 0.9683099 | 3 | 0.1760563 |
| D2 B2-2255 | 0 | 1.9051839 | 0 | 0.664599 | 1 | 1.5950377 | 1 | 0.1329198 |
| D1 B2-2270 | 1 | 2.4647887 | 0 | 0.9242958 | 0 | 0.528169 | 1 | 0.1320423 |
| D2 B2-2256 | 0 | 1.9051839 | 0 | 0.664599 | 0 | 0.7975188 | 0 | 0.0886132 |
| D2 B2-2257 | 0 | 1.9051839 | 0 | 0.664599 | 0 | 0.7975188 | 0 | 0.0886132 |
| D1 B2-1328 | 0 | 0.4841549 | 0 | 0.9242958 | 0 | 0.528169 | 0 | 0.0880282 |
| D1 B2-95 | 0 | 0.4841549 | 0 | 0.9242958 | 0 | 0.528169 | 0 | 0.0880282 |
Note:
The roll numbers mentioned above are only for representation.
Biology percentile scores, as well as overall percentile scores for the Physics, Chemistry, and Biology (PCB) group, will be calculated using the same method.
All the best!
Stay Updated
For further updates, you can stay tuned right here as we will keep bringing the latest updates to you.
Source
Document on Normalization, Maharashtra CET Cell, 04 April, 2025: Click here to read.
Kindly note that any and all information is subject to change as per the State Common Entrance Test (CET) Cell, Ministry of Education, and Government of India.
Also read
MHT CET 2025 Admit Cards Released for PCB
Dos and Don’ts for MHT-CET Exam Day 2025
MHT CET 2025 Mock Test Analysis: Hard Chapters, Easy Chapters, and Important Chapters
Preparation Tips and Free Sample Papers for MHT CET 2025
Maharashtra State CET Cell Launches ATAL Initiative for Students
MHT CET College Predictor 2025: Find Colleges by Percentile
MHT-CET Colleges: Top Engineering and Pharmacy Colleges through MHT CET