

Over lakhs of students took the MHT CET 2026 exam this year, that was conducted in multiple sessions to manage the large number of candidates. Each session featured a different question paper, with slight variations in difficulty levels.
So, what happens if your paper felt tougher than someone else’s? Or if another shift seemed easier?
That’s where the MHT CET score normalization process comes in ensuring every candidate is evaluated fairly, regardless of the session they appeared in.
So, What is Normalization?
Normalization is a method used to balance scores across different exam shifts by bringing them onto a common scale. Since each session may vary slightly in difficulty, this process ensures that every candidate is assessed under comparable conditions.
In simple terms, it eliminates any advantage or disadvantage caused by an easier or tougher paper. The final outcome of this process is your MHT-CET score, which is expressed as a percentile.
Step-by-Step Breakdown of the Normalization Process and Percentile
Score Calculation
STEP 1: Distribution of Examinee
To maintain balance, candidates are randomly distributed across four sessions conducted over two days, with two shifts each day. This ensures that every session has a nearly equal number of examinees.
- Session-1: Day-1 Batch-1 (D1 B1)
- Session-2: Day-1 Batch-2 (D2 B2)
- Session-3: Day-2 Batch-1 (D3 B3)
- Session- 4: Day-2 Batch-2 (D4 B4)
If more days or shifts are needed, candidates will be further distributed in the same balanced manner to preserve fairness. This method ensures an unbiased allocation process, and given the vast number of candidates appearing nationwide, the chances of any distribution bias are extremely minimal.
STEP 2: Preparing Results for Each Session
The results for every session will be compiled in two separate formats:
- Raw scores
- Percentile scores
Understanding Percentile Scores at a Glance
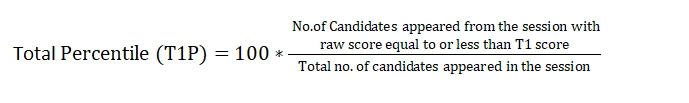
A percentile score represents your relative performance by converting your raw marks onto a scale from 0 to 100 for each session, where 100 corresponds to the highest score achieved in that session.
Here’s how a candidate’s percentile score is calculated:

Note: A percentile score is different from the percentage of marks you score. Also, the overall percentile is not calculated as an average or sum of the percentiles of individual subjects.
To get a clearer picture of how normalization and percentile scoring function, let’s walk through an example.
Imagine an MHT-CET exam conducted in four sessions, as mentioned below:
(i) Distribution of candidates:
Session-1: Day-1 Batch-1
Session-2: Day-1 Batch-2
Session-3: Day-2 Batch-1
Session- 4: Day-2 Batch-2
| Session | Day-Batch | No. of Candidates | Marks | |||
| Absent | Present | Total | Highest | Lowest | ||
| 1 | D1 B1 | 150 | 2249 | 2399 | 154 | 1 |
| 2 | D1 B2 | 186 | 2272 | 2458 | 157 | 0 |
| 3 | D2 B1 | 215 | 2216 | 2431 | 149 | 0 |
| 4 | D2 B2 | 166 | 2257 | 2423 | 161 | 0 |
In this system, the highest scorer in each session is given a percentile of 100, indicating that every other candidate in that session has achieved a score equal to or lower than theirs.
Highest raw score and percentile score:
In each session, the top raw score is scaled to a percentile value of 100.
| Session | Total Candidates Appeared | Highest Raw Score | Candidates Who Scored EQUAL OR LESS THAN the Highest Raw Score | Percentile Score | Remarks |
| 1 | 2249 | 154 | 2249 |
100.0000000 [(2249/2249)*100] |
i.e. all the highest raw scores would be normalized to 100 Percentile Score for their respective session. |
| 2 | 2272 | 157 | 2272 |
100.0000000 [(2272/2272)*100] |
|
| 3 | 2216 | 149 | 2216 |
100.0000000 [(2216/2216)*100] |
|
| 4 | 2257 | 161 | 2257 |
100.0000000 [(2257/2257)*100] |
Lowest raw score and percentile score:
The percentile for the lowest raw scores in each session is calculated considering the total number of candidates within that same session.
| Session | Total Candidates Appeared | Lowest Raw Score | Candidates Who Scored EQUAL OR LESS THAN Lowest Raw Score | Percentile Score | Remarks |
| 1 | 2249 | 1 | 2 |
(2/2249) [(2/2249)*100] |
i.e. all the highest raw scores would be normalized to 100 Percentile Score for their respective session. |
| 2 | 2272 | 0 | 2 |
(2/2272) [(2/2272)*100] |
|
| 3 | 2216 | 0 | 1 |
(1/2216) [(1/2216)*100] |
|
| 4 | 2257 | 0 | 2 |
(2/2257) [(2/2257)*100] |
The percentile score will be treated as the final normalized score, replacing a candidate’s raw marks. To minimize ties or score clustering, these percentiles are calculated with precision up to seven decimal places.
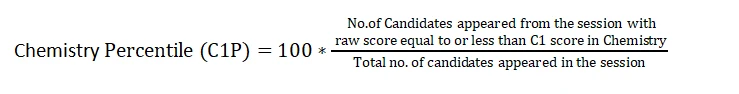
The calculation is carried out individually for each subject i.e. Mathematics, Physics, and Chemistry as well as for the overall aggregate score, as outlined below:


STEP 3: Compilation of MHT-CET Scores
The total MHT-CET scores will be compiled as follows:
The percentile scores derived from the total raw marks across all four sessions (as calculated in Step 2) will be consolidated and designated as the CET scores. These will be used to prepare the final results.
Additionally, separate percentile scores will be computed for the overall total as well as for each subject, that is, Physics, Chemistry, and Mathematics across all sessions.
| PERCENTILE : SESSION-1 i.e. DAY-1 Batch-1 | ||||||||
| Roll Number | Physics | Chemistry | Mathematics | PCM Total | ||||
| Raw Score | Percentile | Raw Score | Percentile | Raw Score | Percentile | Raw Score | Percentile | |
| D1 B1-01 | 38 | 89.2841263 | 30 | 100 | 86 | 99.9555358 | 154 | 100 |
| D1 B1-02 | 45 | 100 | 26 | 99.0217875 | 83 | 98.9773233 | 154 | 100 |
| D1 B1-03 | 45 | 100 | 22 | 92.0409071 | 86 | 99.9555358 | 153 | 99.9119718 |
| D1 B1-04 | 45 | 100 | 22 | 92.0409071 | 86 | 99.9555358 | 153 | 99.9119718 |
| D1 B1-05 | 45 | 100 | 26 | 99.0217875 | 82 | 98.710538 | 153 | 99.9119718 |
| ↓ | ↓ | ↓ | ↓ | ↓ | ↓ | ↓ | ↓ | ↓ |
| ↓ | ↓ | ↓ | ↓ | ↓ | ↓ | ↓ | ↓ | ↓ |
| ↓ | ↓ | ↓ | ↓ | ↓ | ↓ | ↓ | ↓ | ↓ |
| D1 B1-2244 | 3 | 3.5571365 | 2 | 6.8030236 | 2 | 2.4010671 | 7 | 1.3644366 |
| D1 B1-2245 | 2 | 2.4455313 | 0 | 1.2449978 | 3 | 2.801245 | 5 | 1.2323944 |
| D1 B1-2246 | 1 | 1.734104 | 0 | 1.2449978 | 3 | 2.801245 | 4 | 1.1883803 |
| D1 B1-2247 | 0 | 0.3112494 | 2 | 6.8030236 | 0 | 0.5780347 | 2 | 1.1443662 |
| D1 B1-2248 | 0 | 0.3112494 | 1 | 2.7567808 | 0 | 0.5780347 | 1 | 1.1003521 |
| D1 B1-2249 | 1 | 1.734104 | 0 | 1.2449978 | 0 | 0.5780347 | 1 | 1.1003521 |
| PERCENTILE : SESSION-2 i.e. DAY-1 Batch-2 | ||||||||
| Roll Number | Physics | Chemistry | Mathematics | PCM Total | ||||
| Raw Score | Percentile | Raw Score | Percentile | Raw Score | Percentile | Raw Score | Percentile | |
| D1 B2-01 | 45 | 100 | 30 | 100 | 82 | 99.9559859 | 157 | 100 |
| D1 B2-02 | 45 | 100 | 30 | 100 | 82 | 99.9559859 | 157 | 100 |
| D1 B2-03 | 45 | 100 | 30 | 100 | 82 | 99.9559859 | 157 | 100 |
| D1 B2-04 | 41 | 97.5792254 | 30 | 100 | 82 | 99.9559859 | 153 | 99.8679577 |
| D1 B2-05 | 41 | 97.5792254 | 26 | 94.6742958 | 86 | 100 | 153 | 99.8679577 |
| ↓ | ↓ | ↓ | ↓ | ↓ | ↓ | ↓ | ↓ | ↓ |
| ↓ | ↓ | ↓ | ↓ | ↓ | ↓ | ↓ | ↓ | ↓ |
| ↓ | ↓ | ↓ | ↓ | ↓ | ↓ | ↓ | ↓ | ↓ |
| D1 B2-2268 | 3 | 4.665493 | 1 | 2.1126761 | 0 | 0.528169 | 4 | 0.2200704 |
| D1 B2-2269 | 2 | 3.3010563 | 0 | 0.9242958 | 1 | 0.9683099 | 3 | 0.1760563 |
| D1 B2-2270 | 1 | 2.4647887 | 0 | 0.9242958 | 0 | 0.528169 | 1 | 0.1320423 |
| D1 B2-2271 | 0 | 0.4841549 | 0 | 0.9242958 | 0 | 0.528169 | 0 | 0.0880282 |
| D1 B2-2272 | 0 | 0.4841549 | 0 | 0.9242958 | 0 | 0.528169 | 0 | 0.088028 |
| PERCENTILE : SESSION-3 i.e. DAY-2 Batch-1 | ||||||||
| Roll Number | Physics | Chemistry | Mathematics | PCM Total | ||||
| Raw Score | Percentile | Raw Score | Percentile | Raw Score | Percentile | Raw Score | Percentile | |
| D2 B1-01 | 37 | 96.6155235 | 30 | 100 | 82 | 99.8646209 | 149 | 100 |
| D2 B1-02 | 41 | 99.4584838 | 26 | 96.6155235 | 82 | 99.8646209 | 149 | 100 |
| D2 B1-03 | 45 | 100 | 23 | 87.8610108 | 78 | 98.5108303 | 146 | 99.9119718 |
| D2 B1-04 | 41 | 99.4584838 | 26 | 96.6155235 | 79 | 99.0974729 | 146 | 99.9119718 |
| D2 B1-05 | 41 | 99.4584838 | 30 | 100 | 74 | 94.9909747 | 145 | 99.8239437 |
| ↓ | ↓ | ↓ | ↓ | ↓ | ↓ | ↓ | ↓ | ↓ |
| ↓ | ↓ | ↓ | ↓ | ↓ | ↓ | ↓ | ↓ | ↓ |
| ↓ | ↓ | ↓ | ↓ | ↓ | ↓ | ↓ | ↓ | ↓ |
| D2 B1-2212 | 2 | 5.099278 | 1 | 1.2635379 | 2 | 3.4747292 | 5 | 2.7288732 |
| D2 B1-2213 | 1 | 3.2039711 | 2 | 3.8357401 | 2 | 3.4747292 | 5 | 2.7288732 |
| D2 B1-2214 | 1 | 3.2039711 | 2 | 3.8357401 | 2 | 3.4747292 | 5 | 2.7288732 |
| D2 B1-2215 | 3 | 8.4837545 | 0 | 0.5866426 | 0 | 1.0379061 | 3 | 2.5528169 |
| D2 B1-2216 | 0 | 1.0830325 | 0 | 0.5866426 | 0 | 1.0379061 | 0 | 2.5088028 |
| PERCENTILE : SESSION-4 i.e. DAY-2 Batch-2 | ||||||||
| Roll Number | Physics | Chemistry | Mathematics | PCM Total | ||||
| Raw Score | Percentile | Raw Score | Percentile | Raw Score | Percentile | Raw Score | Percentile | |
| D2 B2-01 | 41 | 100 | 30 | 100 | 90 | 100 | 161 | 100 |
| D2 B2-02 | 41 | 100 | 30 | 100 | 90 | 100 | 161 | 100 |
| D2 B2-03 | 41 | 100 | 30 | 100 | 86 | 99.0695614 | 157 | 99.9113868 |
| D2 B2-04 | 41 | 100 | 30 | 100 | 86 | 99.0695614 | 157 | 99.9113868 |
| D2 B2-05 | 37 | 98.5378821 | 30 | 100 | 90 | 100 | 157 | 99.9113868 |
| ↓ | ↓ | ↓ | ↓ | ↓ | ↓ | ↓ | ↓ | ↓ |
| ↓ | ↓ | ↓ | ↓ | ↓ | ↓ | ↓ | ↓ | ↓ |
| ↓ | ↓ | ↓ | ↓ | ↓ | ↓ | ↓ | ↓ | ↓ |
| D2 B2-2253 | 3 | 14.4882588 | 0 | 0.664599 | 0 | 0.7975188 | 3 | 0.3101462 |
| D2 B2-2254 | 0 | 1.9051839 | 2 | 4.8294196 | 0 | 0.7975188 | 2 | 0.1772264 |
| D2 B2-2255 | 0 | 1.9051839 | 0 | 0.664599 | 1 | 1.5950377 | 1 | 0.1329198 |
| D2 B2-2256 | 0 | 1.9051839 | 0 | 0.664599 | 0 | 0.7975188 | 0 | 0.0886132 |
| D2 B2-2257 | 0 | 1.9051839 | 0 | 0.664599 | 0 | 0.7975188 | 0 | 0.0886132 |
The percentile scores from all four sessions will be consolidated to derive the overall percentile as well as subject-wise percentiles for Mathematics, Physics, and Chemistry. These combined percentiles will then be used to determine the final CET scores.
| PERCENTILE : All 4 Sessions Combined | ||||||||
| Roll Number | Physics | Chemistry | Mathematics | PCM Total | ||||
| Raw Score | Percentile | Raw Score | Percentile | Raw Score | Percentile | Raw Score | Percentile | |
| D1 B1-01 | 38 | 89.2841263 | 30 | 100 | 86 | 99.9555358 | 154 | 100 |
| D1 B1-02 | 45 | 100 | 26 | 99.0217875 | 83 | 98.9773233 | 154 | 100 |
| D1 B2-01 | 45 | 100 | 30 | 100 | 82 | 99.9559859 | 157 | 100 |
| D1 B2-02 | 45 | 100 | 30 | 100 | 82 | 99.9559859 | 157 | 100 |
| D1 B2-03 | 45 | 100 | 30 | 100 | 82 | 99.9559859 | 157 | 100 |
| D2 B1-01 | 37 | 96.6155235 | 30 | 100 | 82 | 99.8646209 | 149 | 100 |
| D2 B1-02 | 41 | 99.4584838 | 26 | 96.6155235 | 82 | 99.8646209 | 149 | 100 |
| D2 B2-01 | 41 | 100 | 30 | 100 | 90 | 100 | 161 | 100 |
| D2 B2-02 | 41 | 100 | 30 | 100 | 90 | 100 | 161 | 100 |
| D1 B1-03 | 45 | 100 | 22 | 92.0409071 | 86 | 99.9555358 | 153 | 99.9119718 |
| ↓ | ↓ | ↓ | ↓ | ↓ | ↓ | ↓ | ↓ | ↓ |
| ↓ | ↓ | ↓ | ↓ | ↓ | ↓ | ↓ | ↓ | ↓ |
| ↓ | ↓ | ↓ | ↓ | ↓ | ↓ | ↓ | ↓ | ↓ |
| ↓ | ↓ | ↓ | ↓ | ↓ | ↓ | ↓ | ↓ | ↓ |
| ↓ | ↓ | ↓ | ↓ | ↓ | ↓ | ↓ | ↓ | ↓ |
| ↓ | ↓ | ↓ | ↓ | ↓ | ↓ | ↓ | ↓ | ↓ |
| ↓ | ↓ | ↓ | ↓ | ↓ | ↓ | ↓ | ↓ | ↓ |
| ↓ | ↓ | ↓ | ↓ | ↓ | ↓ | ↓ | ↓ | ↓ |
| ↓ | ↓ | ↓ | ↓ | ↓ | ↓ | ↓ | ↓ | ↓ |
| D2 B2-2253 | 3 | 14.4882588 | 0 | 0.664599 | 0 | 0.7975188 | 3 | 0.3101462 |
| D1 B2-2268 | 3 | 4.665493 | 1 | 2.1126761 | 0 | 0.528169 | 4 | 0.2200704 |
| D2 B2-2254 | 0 | 1.9051839 | 2 | 4.8294196 | 0 | 0.7975188 | 2 | 0.1772264 |
| D1 B2-2269 | 2 | 3.3010563 | 0 | 0.9242958 | 1 | 0.9683099 | 3 | 0.1760563 |
| D2 B2-2255 | 0 | 1.9051839 | 0 | 0.664599 | 1 | 1.5950377 | 1 | 0.1329198 |
| D1 B2-2270 | 1 | 2.4647887 | 0 | 0.9242958 | 0 | 0.528169 | 1 | 0.1320423 |
| D2 B2-2256 | 0 | 1.9051839 | 0 | 0.664599 | 0 | 0.7975188 | 0 | 0.0886132 |
| D2 B2-2257 | 0 | 1.9051839 | 0 | 0.664599 | 0 | 0.7975188 | 0 | 0.0886132 |
| D1 B2-1328 | 0 | 0.4841549 | 0 | 0.9242958 | 0 | 0.528169 | 0 | 0.0880282 |
| D1 B2-95 | 0 | 0.4841549 | 0 | 0.9242958 | 0 | 0.528169 | 0 | 0.0880282 |
Note: The roll numbers shown in the table are purely illustrative and do not represent actual candidates.
The same method of percentile calculation is also applied to Biology, along with the combined scores for Physics, Chemistry, and Biology (PCB).
Conclusion
With lakhs of students relying on MHT-CET scores for their future, ensuring fairness is crucial. Although the normalization process may seem complex, it plays a vital role in maintaining a level playing field for all candidates.
If you found this helpful, do share it with fellow aspirants.
Source
Official Notice by CET Cell, 09 April, 2026: click here to read.
Kindly note that any and all information is subject to change as per the CET Cell, Education Ministry, and Government of India.
Important Links
| Tayari Entrance by Target: Best App for NEET, JEE, and MHT CET Preparation 2026 | Understanding the CET Cell: How MHT CET is Conducted |